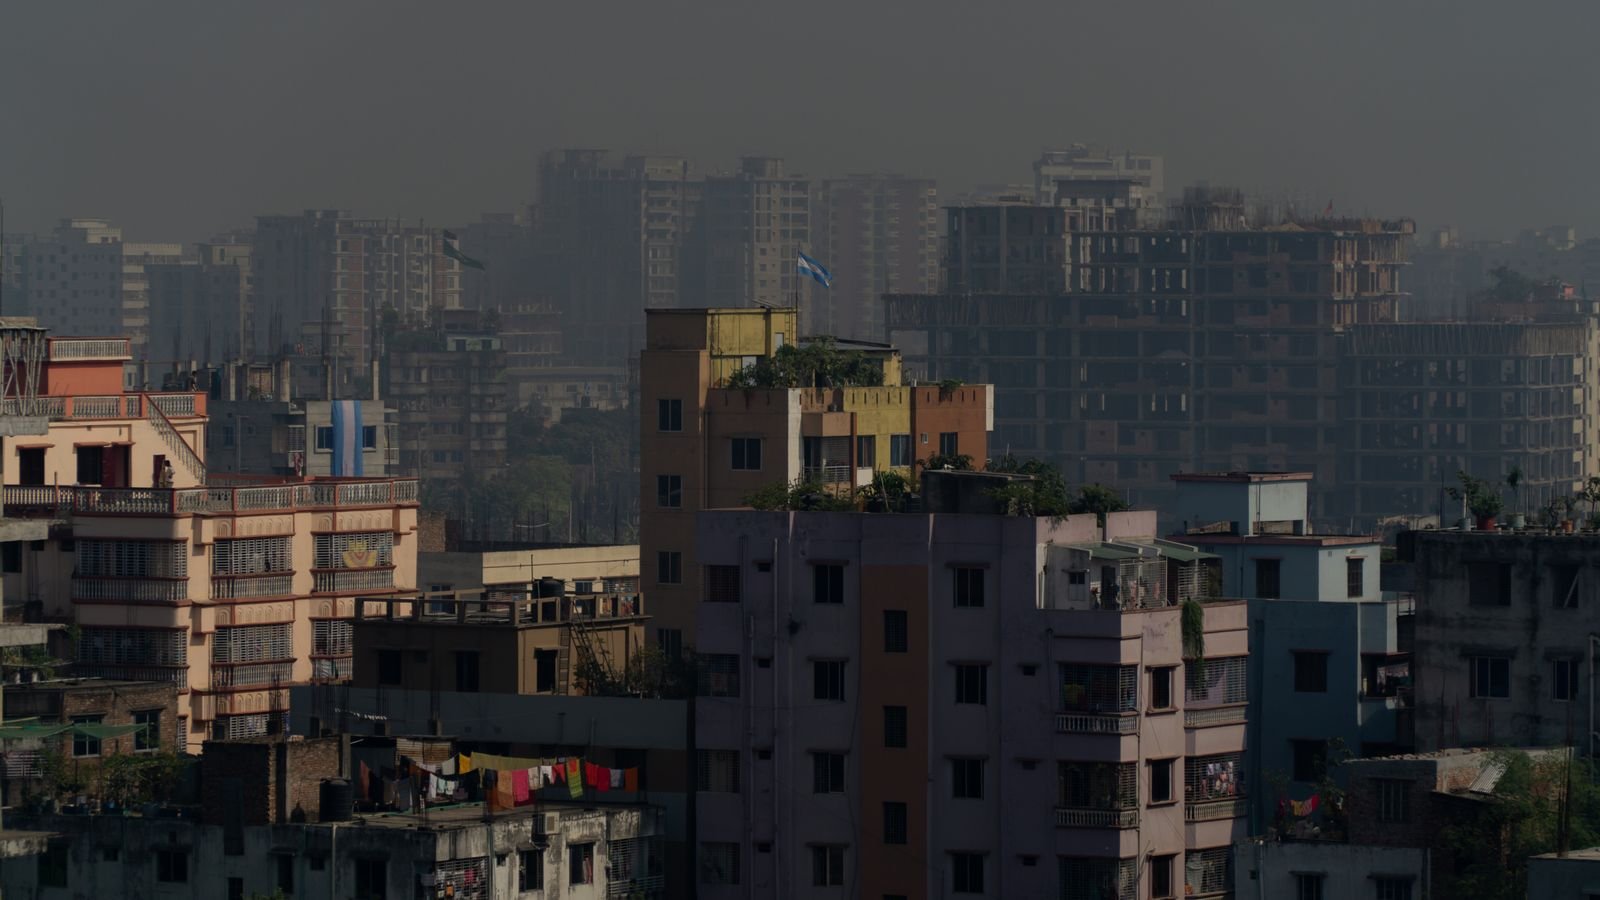
Open Sameer on one phone and IQAir on another during a smoggy Delhi morning, and you’ll often see two very different numbers. Neither app is broken. Indian AQI apps and international ones use different scales and different time windows, so the same air can get two different scores.
The surprise is that the “scarier” app isn’t always the same one. At moderate pollution the US-scale app looks worse, and on the really bad days the Indian number is higher. The table in section 3 shows exactly where the two flip, and section 5 tells you which number to use for which decision.
⚡ Key takeaways
- India’s AQI (used by CPCB’s Sameer app) and the US AQI (used by IQAir and many global apps) have different breakpoints, so the same PM2.5 level gets different numbers.
- Indian official AQI is usually a 24-hour average. Many apps show the latest hourly reading, which can swing a lot during the day.
- At moderate PM2.5 levels, the US scale gives a higher number. Above roughly 80 µg/m³, the Indian scale gives the higher number.
- The most useful figure in any AQI app is the PM2.5 concentration in µg/m³, not the AQI score.
- For official alerts in India, follow CPCB. For deciding whether to step out right now, use an app’s hourly PM2.5 near you.
Why AQI Apps Disagree: Two Scales, Two Clocks
India launched its National Air Quality Index on 17 October 2014. According to the Government of India’s Arthapedia entry, it covers eight pollutants, including PM2.5, PM10, nitrogen dioxide and ozone. The overall AQI is the worst of those sub-indices, which in Indian winters is usually PM2.5.
International apps mostly use a different system. IQAir says its AirVisual AQI is calculated with the US EPA’s air quality standards. Both scales run from 0 to 500 with colour bands, which is exactly why people compare them, but the cut-offs inside those bands aren’t the same.
The second difference is time. The Quint’s AQI explainer found that CPCB’s Sameer app and website show a 24-hour average, while some global apps show the current value. Pollution in winter usually builds up overnight, so an hourly reading at 7 AM can be far worse than the 24-hour average for the same station.
How Each AQI Scale Rates the Same PM2.5
Here are the official PM2.5 bands for both systems. The Indian bands are for 24-hour averages, from the Arthapedia table. The US bands come from the EPA’s February 2024 fact sheet, which tightened the “Good” band from 12.0 to 9.0 µg/m³.
India’s National AQI (PM2.5, 24-hour average)
| Indian AQI | Category | PM2.5 (µg/m³) |
|---|---|---|
| 0–50 | Good | 0–30 |
| 51–100 | Satisfactory | 31–60 |
| 101–200 | Moderately polluted | 61–90 |
| 201–300 | Poor | 91–120 |
| 301–400 | Very poor | 121–250 |
| 401–500 | Severe | Above 250 |
US AQI (used by IQAir and many global apps)
| US AQI | Category | PM2.5 (µg/m³) |
|---|---|---|
| 0–50 | Good | 0–9.0 |
| 51–100 | Moderate | 9.1–35.4 |
| 101–150 | Unhealthy for sensitive groups | 35.5–55.4 |
| 151–200 | Unhealthy | 55.5–125.4 |
| 201–300 | Very unhealthy | 125.5–225.4 |
| 301 and above | Hazardous | 225.5 and above |
Compare the second row of each table. India calls PM2.5 of 60 µg/m³ “Satisfactory”. On the US scale, anything above 35.4 is already “Unhealthy for sensitive groups”. That gap is the main reason global apps look gloomier on ordinary days.
💡 Pro tip
Most AQI apps let you tap a station to see each pollutant. Look for “PM2.5” and the unit µg/m³. That number means the same thing in every app, whatever scale it uses for the headline score.
 Also readN95 Mask for Pollution: The AQI Number Where It Starts to Matter
The Same Air, Two Scores: Where the Apps Flip
To make this concrete, we plugged the same PM2.5 readings into both official formulas. These are our calculations from the breakpoints in the table above, rounded to whole numbers.
| PM2.5 (µg/m³) | Indian AQI | Indian band | US AQI | US band |
|---|---|---|---|---|
| 25 | 42 | Good | 81 | Moderate |
| 40 | 67 | Satisfactory | 112 | Unhealthy for sensitive groups |
| 60 | 100 | Satisfactory | 154 | Unhealthy |
| 100 | 234 | Poor | 182 | Unhealthy |
| 150 | 324 | Very poor | 225 | Very unhealthy |
| 200 | 362 | Very poor | 275 | Very unhealthy |
So on a mildly hazy day, an app on the US scale can show 150 while Sameer says 100. But on a bad November day with PM2.5 at 200, Sameer can show 362 while the US-scale app shows around 275. The Quint saw this in 2019: one Delhi monitor at about 135 µg/m³ read 312 on the Indian scale and 193 on the US scale used at the time.

The Catch: Hourly Readings vs 24-Hour Averages
This is where most of the confusion actually comes from. Even if two apps use the same scale, one may show the past hour and the other the past 24 hours.
⚠️ Watch out
A 24-hour average smooths out the worst hours. Pollution can change a lot between night, morning and afternoon, so if you’re planning a morning walk, a 24-hour AQI can look better or worse than the air you’ll actually breathe at 6 AM.
Other reasons two apps disagree:
- Different stations. Your app may pick a monitor 5 km away, near a highway or in a park. Check the station name.
- Estimates between monitors. Where there’s no monitor nearby, an app may show an estimate, which can be off for your street.
- Indian AQI stops at 500. The Quint notes Indian AQI caps at 500, while some global apps keep counting past it. A “700” in one app and “500” in another can describe similar air.
- Update lag. Official data can take time to appear, so one app may simply be a few hours behind.
None of this means air is “fine” because one app shows a smaller number. The World Health Organization-air-quality-and-health) estimates that 99% of the world’s population lived in places that didn’t meet its air quality guidelines in 2019, and that outdoor air pollution caused about 4.2 million premature deaths that year.
How to Read Your AQI App in 4 Steps
- Pick one app and stick with it for day-to-day comparisons, so changes mean something.
- Check the station. Choose the monitor closest to where you’ll actually be: home, school or office.
- Tap through to PM2.5 in µg/m³. Compare that number with the tables above. Below 30 is “Good” on India’s scale (the US scale wants it under 9); above 60, both scales say the air has moved into a worse band.
- Look at the hourly trend. If PM2.5 is falling by late morning, that’s a better time for a walk than dawn.
For how to time exercise around these numbers, see our guide on morning walks in smog season. If the number at home stays high, our air purifier buying guide explains what CADR to look for.

Which AQI App Should You Trust?
✅ Our verdict
Use CPCB’s numbers (Sameer app or the CPCB website) for official alerts, school notices and anything the government acts on, because that’s the Indian standard. Use an app that shows hourly PM2.5 near you for everyday choices like walks, cycling to work or opening windows. When they disagree, trust the PM2.5 µg/m³ figure over either AQI score.
The honest answer is that both apps are “right” by their own rules. The Indian scale is designed around Indian standards and averages; the US scale is stricter at low levels. If you have small children, older parents or someone with asthma at home, the stricter reading is the safer one to plan around. Our post on asthma in smog season covers what families can do on high-AQI days.
Frequently Asked Questions
Why is AQI different in Google, IQAir and Sameer?
They often use different scales and time windows. Sameer follows India’s National AQI with mostly 24-hour averages, while IQAir uses the US EPA scale. Apps may also pick different monitoring stations.
Is the Indian AQI scale the same as the US AQI?
No. Both run from 0 to 500, but the PM2.5 cut-offs differ. India’s “Good” band goes up to 30 µg/m³, while the US “Good” band ends at 9.0 µg/m³ after the EPA’s 2024 update.
Which AQI is more accurate for India?
Both use real monitor data but different rules. CPCB’s AQI is the official Indian standard. For personal decisions, the PM2.5 concentration in µg/m³ at the nearest station is the clearest figure.
What PM2.5 level is safe for a morning walk?
Below 30 µg/m³ is “Good” on India’s scale; above 60 is where both scales move into worse bands. People with asthma, heart disease, older adults and children should be more cautious and follow their doctor’s advice.
Why does my AQI app show above 500?
India’s AQI is capped at 500, but some apps keep counting beyond it. A reading above 500 means extremely high pollution either way.
The Bottom Line
AQI apps disagree because they measure the same air with different rulers and different clocks. Look past the headline score to the PM2.5 number, choose the station closest to you, and check the hourly trend before you head out. This article is for information only; if smog affects your breathing or a family member’s health, consult a doctor.
Keep reading
Read nextN95 Mask for Pollution: The AQI Number Where It Starts to Matter Read nextAir Purifier for Home: The CADR Number That Matters for Your Room
 Read nextEye Irritation From Pollution: 8 Fixes and When to Worry
Sources
- Arthapedia (Government of India): National Air Quality Index bands and breakpoints
- US EPA: PM NAAQS and Air Quality Index fact sheet (February 2024)
- IQAir: What is AQI (uses the US EPA standard)
- The Quint: Why Sameer and AQICN show different AQI numbers
- WHO: Ambient (outdoor) air quality and health fact sheet-air-quality-and-health)